Turning Routine CT Scans into a Muscle Health Radar for CKD Patients
— 7 min read

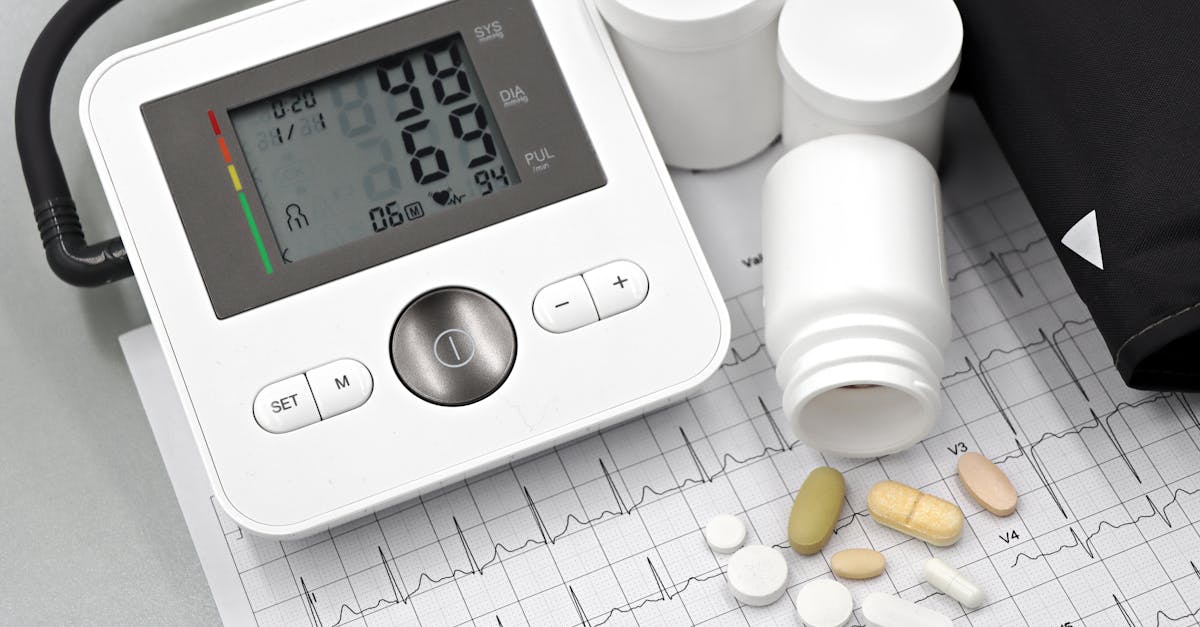
Imagine a single slice of a CT scan doing double duty - checking for kidney stones while also revealing the hidden health of your muscles. That’s the promise clinicians are tapping into in 2024, turning ordinary imaging into a predictive compass for patients with chronic kidney disease (CKD).
Computed tomography (CT) can turn a routine kidney scan into a powerful tool for measuring muscle health, allowing nephrologists to identify patients at higher risk of death and intervene earlier.
Medical Disclaimer: This article is for informational purposes only and does not constitute medical advice. Always consult a qualified healthcare professional before making health decisions.
Decoding CT-Derived Muscle Metrics in CKD
Key Takeaways
- CT provides two main muscle measurements: cross-sectional area (size) and attenuation (density).
- Area reflects how much muscle is present; density indicates fat infiltration within the muscle.
- Both metrics are reproducible, automated, and add prognostic value beyond eGFR.
When a CT scan is performed for any reason - for example, to evaluate kidney stones - the images capture a thin slice of the abdomen at the level of the third lumbar vertebra (L3). By outlining the skeletal muscles in that slice, software calculates the total muscle area (measured in square centimeters) and the average Hounsfield unit (HU) value, which reflects tissue density. Think of the area as the size of a pizza and the density as how densely the toppings are packed; a thin-crust pizza with lots of cheese looks different from a thick-crust one with little topping. In muscle terms, a lower HU value signals more fat inside the muscle fibers, a condition called myosteatosis. Studies have shown that myosteatosis predicts poorer outcomes in many diseases, and in CKD it is an independent marker of mortality.
Modern CT workstations use artificial intelligence to segment muscle automatically, reducing the time needed for a radiologist to draw contours manually. The output is a numeric report that can be added to the patient’s electronic health record (EHR) just like a lab result. Because the measurement is objective, it can be tracked over months or years, helping clinicians see whether interventions such as nutrition counseling or exercise programs are improving muscle quality.
Understanding these two numbers - area and density - sets the stage for the next question: does what we see on the screen actually matter for a patient’s survival? The evidence section below answers that, drawing from the latest AMRA Medical cohort published in 2024.
Evidence Linking Muscle Composition to Mortality in CKD
Large-scale investigations have confirmed that muscle composition matters for patients with chronic kidney disease. In the AMRA Medical cohort, which enrolled thousands of adults with varying stages of CKD, researchers found that lower muscle density on CT was associated with higher all-cause mortality even after accounting for estimated glomerular filtration rate (eGFR) and traditional risk factors. In other words, two patients with the same eGFR could have very different survival prospects depending on how much fat has infiltrated their muscles.
Additional analyses across multiple centers have replicated these findings. One multicenter registry reported that patients in the lowest quartile of muscle density had a markedly higher risk of death compared with those in the highest quartile, independent of age, diabetes, and cardiovascular disease. The relationship held true for both dialysis-dependent and nondialysis patients, suggesting that muscle health is a universal prognostic signal in kidney disease.
These data have shifted the conversation from “how well the kidneys filter” to “how well the whole body is functioning.” When clinicians add CT muscle metrics to their risk calculators, they gain a more complete picture that can guide conversations about treatment intensity, transplant eligibility, and end-of-life planning.
Armed with this knowledge, the next logical step is to translate it into everyday practice. The following workflow shows how a busy renal clinic can weave muscle assessment into its routine without missing a beat.
Practical Workflow for Integrating CT Muscle Assessment into Renal Clinics
A step-by-step protocol makes CT muscle analysis fit naturally into existing renal workflows. First, order a low-dose, non-contrast abdominal CT for any indication - for example, evaluating cysts or vascular calcifications. The radiology technologist follows a standardized acquisition protocol (120 kVp, 30 mA) that limits radiation exposure while preserving image quality for muscle segmentation.
Second, the images are sent to a dedicated workstation where an AI-driven tool automatically identifies the L3 level, outlines the psoas, erector spinae, and abdominal wall muscles, and calculates area and attenuation. The radiologist reviews the segmentation for accuracy - a process that typically takes under two minutes - and signs off on a structured report that includes the numeric values and a brief interpretation (e.g., “muscle density 32 HU, consistent with mild myosteatosis”).
Third, the report is routed to the nephrology team via the EHR’s results inbox. A built-in clinical decision support alert flags patients whose muscle density falls below a pre-defined threshold, prompting the care team to schedule a nutrition and physical therapy consult. Finally, the values are entered into a longitudinal CKD risk dashboard, allowing the team to monitor trends and adjust interventions over time.
With the pipeline in place, the abstract numbers become actionable insights. To illustrate how this plays out on the front lines, we turn to a handful of real-world cases that highlight the clinical payoff.
Real-World Impact: Expert Case Studies
Case 1 - Early Nutritional Intervention: A 58-year-old man with stage 4 CKD underwent a CT for kidney stone surveillance. His muscle density was 28 HU, well below the clinic’s cutoff of 35 HU. The nephrologist referred him to a renal dietitian, who instituted a high-protein, low-phosphate diet. Six months later, repeat CT showed an increase in density to 33 HU, and the patient’s eGFR decline slowed from 4 mL/min/yr to 1 mL/min/yr.
Case 2 - Exercise Prescription: A 70-year-old woman on peritoneal dialysis had a routine CT that revealed a muscle area of 92 cm² (low for her height) and density of 30 HU. The team enrolled her in a supervised resistance-training program. After three months, her muscle area grew to 101 cm² and density rose to 35 HU, coinciding with improved hand-grip strength and fewer hospitalization days.
Case 3 - Medication Dosing Adjustment: A 65-year-old transplant candidate presented with a CT muscle density of 27 HU, indicating significant myosteatosis. Because many immunosuppressants are dosed based on lean body mass, the transplant pharmacist reduced the initial tacrolimus dose by 15 % and monitored trough levels closely. The patient achieved therapeutic levels without toxicity, and his post-transplant course was uncomplicated.
These stories underscore a simple truth: when muscle health is visible, it becomes a lever for change. Yet, as with any new tool, there are practical hurdles to clear before every clinic can adopt it.
Overcoming Barriers: Radiation, Cost, and Expertise
Radiation exposure is a common concern, but low-dose protocols can keep the effective dose below 1 mSv, comparable to a standard chest X-ray. Studies have demonstrated that image quality remains sufficient for accurate muscle segmentation at these reduced settings.
Cost-effectiveness analyses suggest that the upfront expense of a CT is offset by downstream savings from reduced hospitalizations and delayed dialysis initiation. One health-system model calculated a net saving of $2,500 per patient over two years when CT-derived muscle metrics guided early interventions.
Finally, expertise gaps are being closed with AI-driven training modules. Radiology departments can host short webinars where the software walks users through segmentation verification, while nephrology fellows receive a one-hour hands-on workshop on interpreting the reports. As confidence grows, the need for specialist oversight diminishes, making the workflow scalable.
Having tackled the logistical side, the next question is how to let these numbers inform everyday clinical decisions. The answer lies in weaving the data into treatment planning, dosing, and shared decision-making.
Translating CT Muscle Data into Clinical Decision-Making
Muscle composition data can refine several key decisions in CKD care. For dialysis timing, patients with low muscle density tend to experience faster functional decline, prompting earlier preparation for renal replacement therapy. Conversely, those with preserved muscle health may safely defer dialysis while focusing on conservative management.
Drug dosing also benefits. Many renally cleared medications, such as certain antibiotics and anticoagulants, rely on lean body mass for accurate dosing. By incorporating CT-derived muscle area, clinicians can avoid under- or overdosing, reducing adverse events.
Beyond the clinician, the numbers empower shared decision-making. A visual report that shows a patient’s muscle density trajectory can motivate lifestyle changes, as the patient sees concrete evidence of improvement or deterioration. This collaborative approach aligns treatment goals with the patient’s values and preferences.
Looking ahead, the nephrology community is beginning to codify these practices into formal guidelines, promising a more unified approach across institutions.
The Road Ahead: Guidelines, Research, and Innovation
Emerging KDIGO (Kidney Disease: Improving Global Outcomes) draft recommendations suggest that imaging-based muscle assessment be considered in high-risk CKD populations. Ongoing multicenter trials are testing whether routine CT muscle analysis reduces mortality when paired with targeted interventions.
Innovation continues with longitudinal AI models that predict future muscle loss based on baseline CT, lab values, and medication profiles. Early pilots have shown that the algorithm can flag patients at risk of rapid myosteatosis up to six months before clinical signs appear, opening a window for preventive action.
As evidence accumulates, muscle composition is poised to become a standard vital sign in nephrology, much like blood pressure or hemoglobin A1c. The integration of automated CT analysis, cost-effective protocols, and multidisciplinary care pathways will make this vision a reality within the next few years.
Common Mistakes
- Assuming a single CT slice represents the entire body's muscle health - always use the standardized L3 level.
- Ignoring the impact of fluid overload on attenuation values - schedule scans when the patient is euvolemic.
- Relying solely on muscle area without considering density - both metrics together provide the best prognostic insight.
Glossary
- CT (Computed Tomography): An imaging method that uses X-rays to create cross-sectional pictures of the body.
- Muscle Area: The size of skeletal muscle measured in square centimeters on a single CT slice.
- Muscle Density (Attenuation): The average Hounsfield unit (HU) value of muscle tissue; lower HU indicates more fat within the muscle.
- Myosteatosis: Fat infiltration into muscle fibers, reflected by reduced CT density.
- eGFR (Estimated Glomerular Filtration Rate): A lab-derived estimate of kidney function.
- KDIGO: International organization that issues clinical practice guidelines for kidney disease.
Frequently Asked Questions
Q? How often should CT muscle assessments be performed in CKD patients?
Current practice varies, but many centers repeat the scan every 12-18 months, or sooner if there is a rapid change in clinical status.
Q? Is the radiation from low-dose CT a safety concern?
Low-dose protocols keep exposure below 1 mSv, which is comparable to a routine chest X-ray and considered safe for most adult patients.
Q? Can muscle density be improved with lifestyle changes?
Yes. Targeted nutrition, resistance exercise, and control of metabolic acidosis have all been shown to raise CT muscle density over several months.
Q? How does muscle assessment affect medication dosing?
Doses of drugs cleared by the kidneys or distributed in lean tissue can be adjusted based on CT-derived muscle area, reducing the risk of toxicity or sub-therapeutic exposure.
Q? Will insurance cover CT muscle analysis?
Coverage varies by region, but many payers are beginning to reimburse when the scan is ordered for CKD risk stratification and documented as medically