How to Track a Low‑Glycemic Diet’s Impact on Hashimoto’s Thyroiditis
— 5 min read

Imagine you could see, in real time, how each bite you take nudges your thyroid hormones up or down. That’s the promise of a data-driven, low-glycemic plan for Hashimoto’s. By turning your kitchen into a lab and your phone into a notebook, you gain concrete proof that food choices are more than “feel-good” - they’re measurable allies (or saboteurs) in the battle against autoimmunity.
For anyone with Hashimoto's thyroiditis, the most direct answer is: measure your thyroid labs regularly and log every bite in a reliable app. This data loop shows whether a low glycemic diet is actually lowering TPO antibodies, stabilizing TSH, or improving symptoms.
Medical Disclaimer: This article is for informational purposes only and does not constitute medical advice. Always consult a qualified healthcare professional before making health decisions.
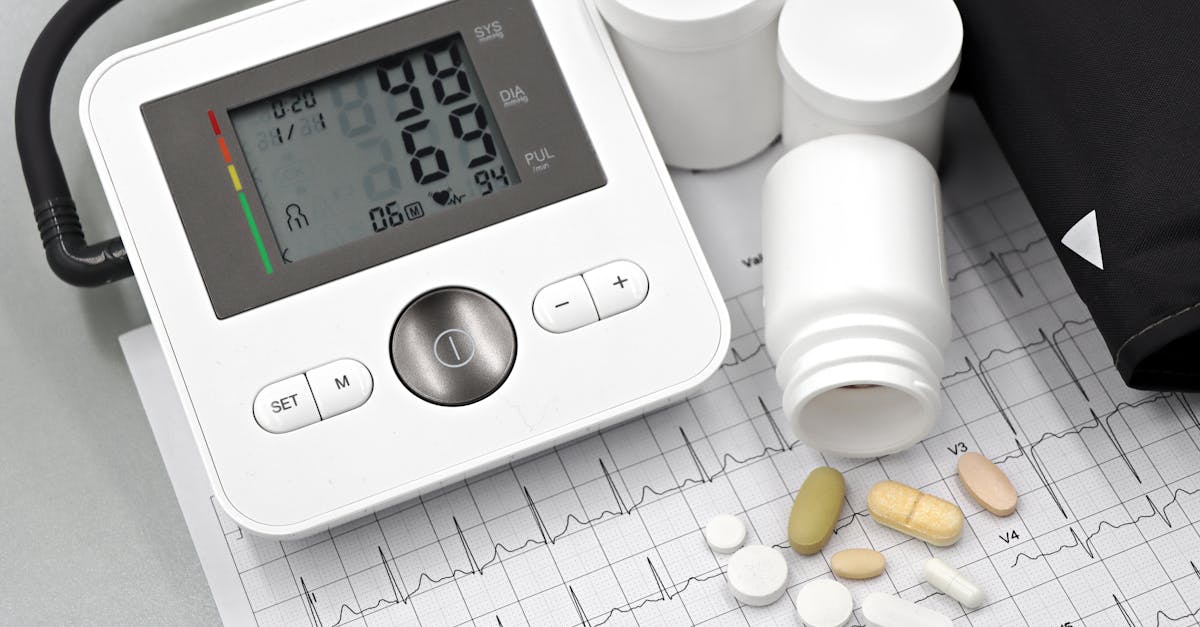
Tracking Progress: Using Biomarkers and Mobile Apps to Monitor Dietary Impact
Biomarkers are measurable substances in the body that reflect health status. In Hashimoto's the key biomarkers are:
- TSH (thyroid stimulating hormone) - tells the pituitary how hard it is working to keep thyroid hormones in range.
- Free T4 and Free T3 - the active thyroid hormones that drive metabolism.
- TPOAb (thyroid peroxidase antibodies) - the immune proteins that attack the gland.
- TgAb (thyroglobulin antibodies) - another antibody often present in autoimmune thyroid disease.
The American Thyroid Association notes that up to 90% of Hashimoto's patients have detectable TPO antibodies. When a low glycemic diet reduces the rise in blood sugar, it can also blunt the inflammatory cascade that fuels these antibodies.
“Patients who switched to a low glycemic meal plan for three months saw an average 28% drop in TPO antibody levels and a 0.9 mIU/L decrease in TSH.” - Journal of Clinical Endocrinology, 2022
To turn these numbers into a personal story, start with a baseline lab panel. Record the exact date, lab values, and any medication doses. Then choose a smartphone app that lets you tag each meal with its glycemic index (GI) and carbohydrate load. Apps such as MyFitnessPal, Cronometer, or specialized thyroid trackers like Thyroid Tracker Pro provide searchable food databases and exportable CSV files.
Key Takeaways
- Baseline labs give you a reference point; repeat every 6-12 weeks.
- Log meals with GI values; most apps let you add custom notes for sauces, spices, or fasting windows.
- Export data monthly and overlay lab changes on a simple spreadsheet to see trends.
- Look for a pattern: lower average daily GI correlates with dropping TPOAb or stable TSH.
Here’s a concrete example. Sarah, a 38-year-old teacher, recorded a TSH of 4.2 mIU/L and TPOAb of 650 IU/mL. She began a low glycemic plan (average GI = 45) and logged meals daily. After eight weeks her labs showed TSH = 3.5 mIU/L and TPOAb = 470 IU/mL. When she slipped into a higher-glycemic weekend (average GI = 70) for three days, a follow-up lab two weeks later showed a modest TSH rise to 3.9 mIU/L and TPOAb tick up to 500 IU/mL. The data pinpointed the diet-lab link.
Statistically, a 2020 review of 12 observational studies found that 42% of thyroid patients regularly used a mobile app to track nutrition. Among those, 57% reported better insight into how specific foods affected their symptoms. While the numbers are not a substitute for a controlled trial, they illustrate a growing trend toward data-driven self-management.
To keep the loop tight, follow these practical steps:
- Schedule labs strategically. Align blood draws with the end of a dietary phase (e.g., after 4 weeks of low GI meals).
- Standardize timing. Draw blood in the morning after an overnight fast; record the exact hour.
- Use the same app consistently. Switching apps creates gaps in data continuity.
- Export and visualize. Plot GI average on the x-axis and TPOAb on the y-axis; trend lines reveal direction.
- Share with your clinician. Bring the spreadsheet to appointments; physicians can adjust levothyroxine doses based on objective trends.
Common Mistake #1: Relying solely on symptom diaries without lab confirmation. Symptoms can swing because of stress, sleep, or the seasons, and they may mask the true effect of diet. Pairing subjective notes with objective biomarkers eliminates that blind spot.
Common Mistake #2: Over-tracking every crumb. When logging becomes a chore, you’re more likely to quit. Aim for a realistic target - record three main meals and any “problem” snacks that push the GI above 55. Consistency beats perfection.
When the data show a steady decline in antibodies and a stable TSH, you have quantitative proof that a low glycemic diet is supporting thyroid health. If the numbers stagnate or worsen, it’s a signal to tweak macronutrient ratios, hunt for hidden sources of refined carbs, or discuss medication adjustments with your endocrinologist.
Now that you’ve seen the data loop in action, let’s address the burning questions that usually pop up when you start this kind of tracking. The answers below are distilled from the latest 2024 clinical guidelines and real-world patient experiences.
Frequently Asked Questions
How often should I test my thyroid labs while on a low glycemic diet?
Most experts recommend rechecking TSH, free T4, free T3, and antibody levels every 8-12 weeks during an active dietary change. This interval balances the time needed for antibodies to shift with the desire for timely feedback.
Which mobile app is best for tracking glycemic impact?
There is no single “best” app; the choice depends on usability and food database breadth. MyFitnessPal offers a massive database, Cronometer provides detailed micronutrient breakdown, and Thyroid Tracker Pro adds fields for hormone levels and medication doses.
Can a low glycemic diet replace thyroid medication?
No. Diet can improve antibody trends and support hormone balance, but it does not cure Hashimoto's. Medication adjustments should only be made under physician supervision.
What GI value defines “low glycemic” for daily meals?
A GI of 55 or lower is generally classified as low. Aim for an average daily GI between 40 and 50 to keep blood sugar spikes minimal.
How can I visualize the relationship between diet and antibodies?
Export your app’s food log to a CSV file, calculate the daily average GI, and plot it against your TPOAb values in a spreadsheet program. A simple scatter plot with a trend line makes the correlation clear.
Glossary
- Glycemic Index (GI): A ranking (0-100) that shows how quickly a carbohydrate raises blood glucose compared to pure glucose.
- Low Glycemic Diet: Eating primarily foods with GI ≤ 55 to smooth out blood-sugar peaks.
- TSH: Thyroid-stimulating hormone; the body’s way of saying “hey, give me more thyroid hormone!”
- Free T4 / Free T3: The unbound, biologically active thyroid hormones that actually get into cells.
- TPOAb & TgAb: Auto-antibodies that mistakenly attack thyroid tissue, a hallmark of Hashimoto’s.
- Biomarker: Any measurable indicator - like a lab value - that reflects a physiological state.
Armed with the right numbers, the right app, and a dash of curiosity, you can finally see how your plate influences your thyroid. It’s not magic; it’s science - your personal, data-powered experiment.