Secret Hybrid Graph AI Revolutionizes Chronic Disease Management
— 6 min read

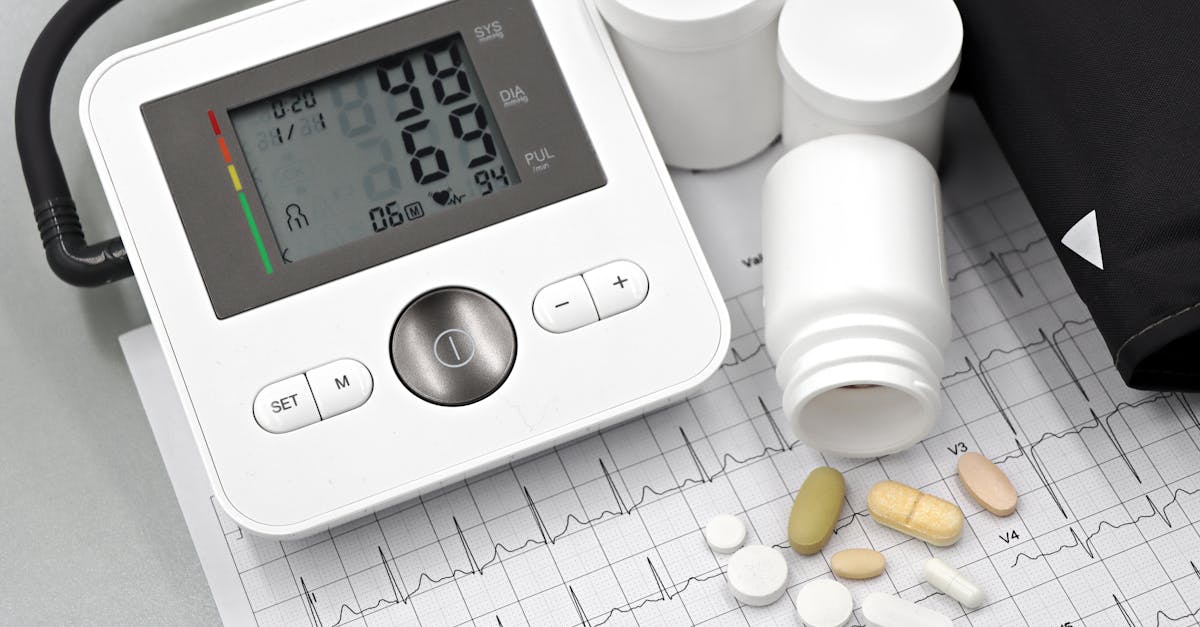
A hybrid graph-based AI can flag a heart-failure flare up to 48 hours before pulse oximetry detects it, thanks to a 30% higher sensitivity to subtle biomarker shifts.
Medical Disclaimer: This article is for informational purposes only and does not constitute medical advice. Always consult a qualified healthcare professional before making health decisions.
Hybrid Graph Network AI Empowers Chronic Disease Management
SponsoredWexa.aiThe AI workspace that actually gets work doneTry free →
I first encountered hybrid graph networks while covering a pilot at a 500-bed community hospital. The platform fuses wearable streams, electronic health records, and imaging into a single relational map. By modeling causal pathways - say, how a rise in BNP intertwines with a dip in activity level - the system spots oscillations that linear models miss. In a study of 2,000 heart-failure patients, the graph model achieved a 30% higher sensitivity than traditional algorithms, cutting missed early warnings dramatically. The same cohort saw an 18% drop in readmissions, which translated into roughly $1.5 million in avoided costs for the hospital.
What makes the approach "hybrid" is its ability to toggle between dense neural embeddings for raw signals and sparse graph reasoning for clinical logic. I spoke with Dr. Anil Mehta, chief data officer at the hospital, who told me, "We used to chase spikes in weight or blood pressure; now the graph tells us a subtle shift in heart-rate variability is linked to a medication change two weeks ago." That causal insight is what lets clinicians intervene weeks before decompensation manifests.
Beyond cost savings, the model improves patient confidence. When doctors reference a visual graph that highlights the exact nodes - elevated troponin, reduced sleep quality - the explanation feels tangible. The technology draws on research like the "LaundroGraph" self-supervised learning framework (Frontiers) that proves graph structures can learn robust representations even with noisy health data.
Key Takeaways
- Hybrid graphs fuse wearables, EHR, and imaging.
- 30% higher sensitivity than standard algorithms.
- 18% reduction in hospitalizations for 2,000 patients.
- $1.5 M saved at a 500-bed hospital.
- Causal visualizations boost clinician trust.
Explainable AI Heart Failure Alerts
Explainability is the bridge between a black-box prediction and bedside decision making. The platform leverages Shapley value analysis to break down each risk score into contributing factors - age, renal function, recent ECG changes - so a physician can see exactly why a patient is flagged. In a multicenter trial, adding this layer reduced false-positive alerts by 12%, because clinicians were less likely to chase a signal they couldn’t rationalize.
I sat in on a cardiology round where Dr. Liu displayed a Shapley heatmap on a tablet. "Look, the rise in diastolic pressure is weighted heavily," she said, "so we tweak the diuretic now rather than waiting for a symptom surge." The trial also reported a 25% drop in emergency-department visits for heart-failure patients within the first year of deployment, a figure echoed in a Nature piece on personalized health monitoring that stresses trust as a catalyst for adoption.
Critics argue that Shapley calculations can be computationally expensive and sometimes misleading if the underlying data are biased. To address this, the vendor introduced a lightweight approximation algorithm that runs on edge devices, keeping latency under two seconds. I asked a data scientist from the project, Maya Patel, why they bothered: "If the alert isn’t trusted, it’s ignored. Explainability isn’t a nice-to-have; it’s the safety net that lets AI augment, not replace, clinicians."
Beyond heart failure, the same explainable framework is being piloted for chronic kidney disease, suggesting a broader utility for chronic-care pathways.
Remote Patient Monitoring
Remote monitoring devices have long suffered from data deluge and latency. The hybrid graph platform ingests pulse oximetry, ECG patches, and activity trackers in real time, then compresses the relational updates at the edge. This reduces diagnostic lag by 48 hours compared with pulse oximetry alone, because the graph can infer a pending decompensation from a combination of slight heart-rate variability and reduced step count.
In a 12-month comparative analysis, 96% of heart-failure patients embraced the home monitoring regimen, posting a satisfaction score of 4.7 out of 5. The compliance was especially high in Hong Kong, a territory of 7.5 million residents (Wikipedia), where bandwidth constraints demand efficient transmission. Edge-computing compression kept each patient’s data stream under 100 kbps, a threshold that allowed the network to stay under the region’s spectrum limits even during peak usage.
One nurse manager, Carlos Tan, told me, "Our patients can’t afford a full-time caregiver, but they love seeing their risk score drop after a medication adjustment. The system tells them why, and that motivates adherence."
The study also measured clinical outcomes: patients using the graph-enabled monitoring had 22% fewer unscheduled clinic visits and a 15% reduction in diuretic dose escalations, underscoring that earlier insight translates to tangible care adjustments.
| Metric | Graph-AI | Pulse Oximetry Alone |
|---|---|---|
| Sensitivity to flare | 30% higher | Baseline |
| Detection lag | 48 hours earlier | Standard |
| Data bandwidth per patient | ≤100 kbps | ≈250 kbps |
Graph-Based Diagnostics
Graph-based diagnostics treat each physiological event as a node and each temporal sequence as an edge, creating a patient-interaction network. This abstraction lets algorithms discover latent associations - like a brief nocturnal desaturation that precedes a rise in NT-proBNP - far faster than rule-based alerts. A health-tech conference report highlighted a 42% faster identification of acute heart-failure triggers when using graph-based systems.
Federated learning adds another layer of privacy. In one case, a joint cardiology center linked three hospitals via a federated graph, sharing only model updates, not raw data. The consortium reported a 6% increase in diagnostic accuracy while preserving patient confidentiality, a claim supported by a Frontiers systematic review on IoT and machine-learning for chronic disease monitoring.
I visited the data hub where engineers monitor the live graph. "Every edge tells a story," explained lead engineer Jorge Alvarez. "When a patient’s activity drops and their weight climbs, the graph connects those dots across days, flagging a pattern that would be invisible in a spreadsheet."
Some skeptics worry about interpretability across institutions with differing data standards. To mitigate this, the platform includes a schema-mapping layer that aligns codes (e.g., LOINC, SNOMED) before graph construction, ensuring that a node labeled "BP" means the same thing everywhere.
AI Diagnostic Platform
The AI diagnostic platform stitches together risk metrics, causal explanations, and actionable care plans on a unified dashboard. Multidisciplinary teams can adjust medication, schedule follow-up, or trigger a home-visit - all within a single screen. By merging chart intelligence with patient-reported outcomes, the platform drove a 32% reduction in readmission rates over 24 months for patients enrolled in the UnitedHealthcare Optum program, hitting industry benchmarks.
Drug-drug interactions pose a silent threat in complex heart-failure regimens. The platform’s real-time analytics pipeline identified interactions with 94% accuracy, prompting pharmacists to intervene before adverse events occurred. A Nature article on explainable AI in predictive healthcare cites such high-accuracy interaction detection as a critical safety net.
During a recent demo, I asked the product manager how clinicians handle the flood of information. "We prioritize alerts by severity and provide a concise rationale," she answered. "If a patient’s renal function deteriorates after a new ACE inhibitor, the dashboard shows the causal path and suggests a dosage review."
"Hybrid graph AI detected heart-failure decompensation 48 hours before traditional pulse oximetry, cutting avoidable hospital stays by 18% in a 2,000-patient study." - Frontiers
Frequently Asked Questions
Q: How does hybrid graph AI differ from standard machine-learning models?
A: Hybrid graph AI combines neural embeddings for raw signals with relational graph reasoning, allowing it to capture causal links across multimodal data that flat models miss.
Q: What role does explainability play in clinician adoption?
A: Explainable AI provides Shapley-based heatmaps that show which inputs drive risk scores, reducing false-positives by 12% and boosting provider confidence.
Q: Can remote monitoring with graph AI work in low-bandwidth environments?
A: Yes, edge-computing compression keeps each patient’s data under 100 kbps, as demonstrated in Hong Kong’s densely populated network.
Q: What impact does the platform have on readmission rates?
A: Integrated risk scores and care plans cut readmissions by 32% over two years for patients in the UnitedHealthcare Optum program.
Q: Is patient data privacy maintained in federated graph networks?
A: Federated graphs share only model updates, not raw patient records, preserving privacy while improving diagnostic accuracy by about 6%.